
Location & Reach
Evidence-based home visiting programs operate in all 50 states, 5 U.S. territories, and the District of Columbia. Home visiting is also provided to American Indian and Alaska Native families both on and off reservations, including families in 22 tribal communities that have received funding from the Maternal, Infant, and Early Childhood Home Visiting (MIECHV) Program.
Where Are Home Visiting Programs Located?
In 2021, more than 3,200 local agencies (Source: Local agencies are usually housed in a central location and serve families in nearby communities. They may also employ staff who provide administrative, data entry, or data management support. Local agencies are operated by state and local government offices, such as departments of health, human services, or education, as well as schools and school districts, hospitals and health clinics, tribal organizations, nonprofit organizations, and faith-based organizations. )Go to footnote #>1 delivered evidence-based home visiting. The map below highlights the presence of evidence-based home visiting programs by county.
Counties With at Least One Local Agency Delivering Evidence-Based Home Visiting (2021)
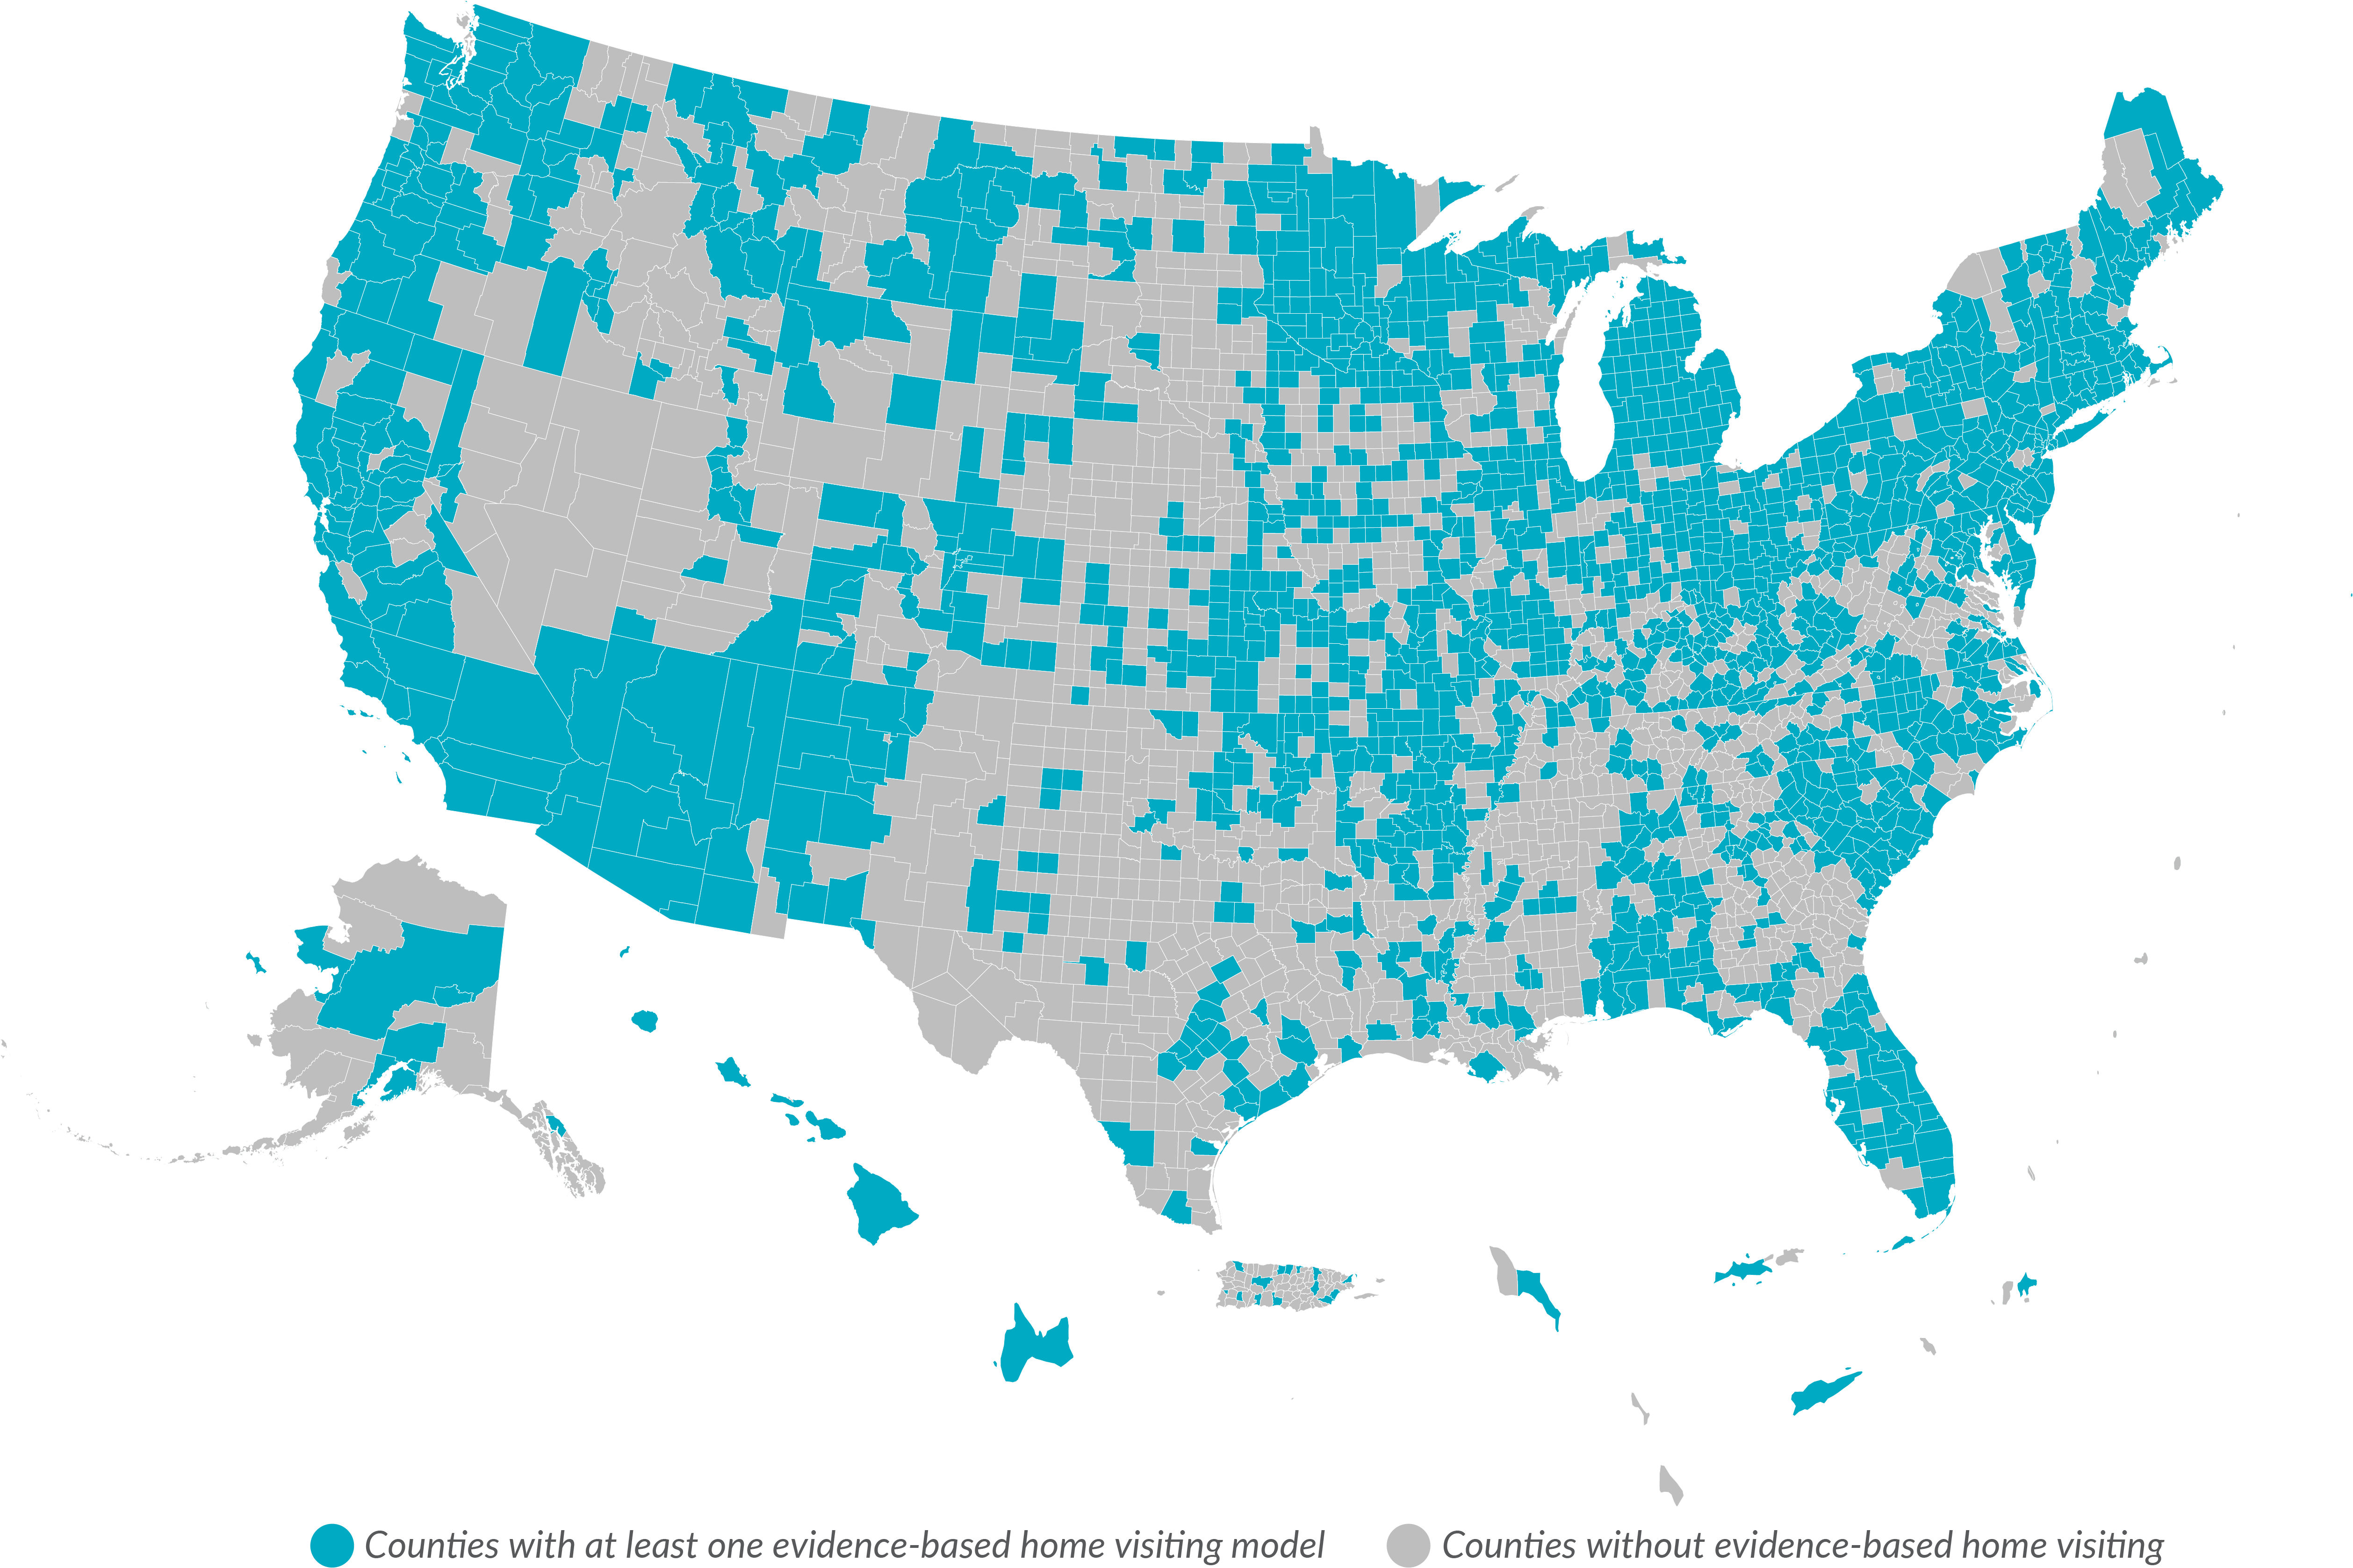
Approximately 54 percent of all U.S. counties have at least 1 local home visiting agency offering evidence-based home visiting. (Source: Estimates are based on data collected from 15 evidence-based model developers on the locations of their local agencies. The 15 models that provided location data are Attachment and Biobehavioral Catch-Up (ABC), Child First, Early Head Start Home-Based Option (EHS), Family Connects, Family Spirit, Health Access Nurturing Development Services (HANDS), Healthy Families America (HFA), Home Instruction for Parents of Preschool Youngsters (HIPPY), Maternal Early Childhood Sustained Home-Visiting (MECSH), Maternal Infant Health Program (MIHP), Minding the Baby, Nurse-Family Partnership (NFP), Parents as Teachers (PAT), Play and Learning Strategies (PALS), and SafeCare Augmented. See [methodology](https://nhvrc.org/yearbook/2022-yearbook/methodology/) for details.)Go to footnote #>2 Twenty-one states have evidence-based home visiting agencies in 75 percent or more of their counties. Others concentrate funds in fewer communities identified in state needs assessments or lack funds to support agencies throughout the state. Six states have home visiting agencies in fewer than 25 percent of their counties.
Which States Have the Greatest Reach in Serving Families?
Local agencies may serve families outside the counties in which they are physically located. This is often the case in rural areas in which families live miles from the local agency and in states with many smaller counties. To better convey programs’ service coverage, rather than agencies’ mailing addresses, we set out to explore where families receive evidence-based home visiting. We collected state- and model-level data about where participating families lived. We also tracked how many zip codes in each state served at least one family to understand the reach—or coverage—of home visiting by state. The map below reflects our findings, with a higher percentage indicating a greater geographic reach within that state.
Percentage of Zip Codes in Which Families Receive Evidence-Based Home Visiting By State (2021)
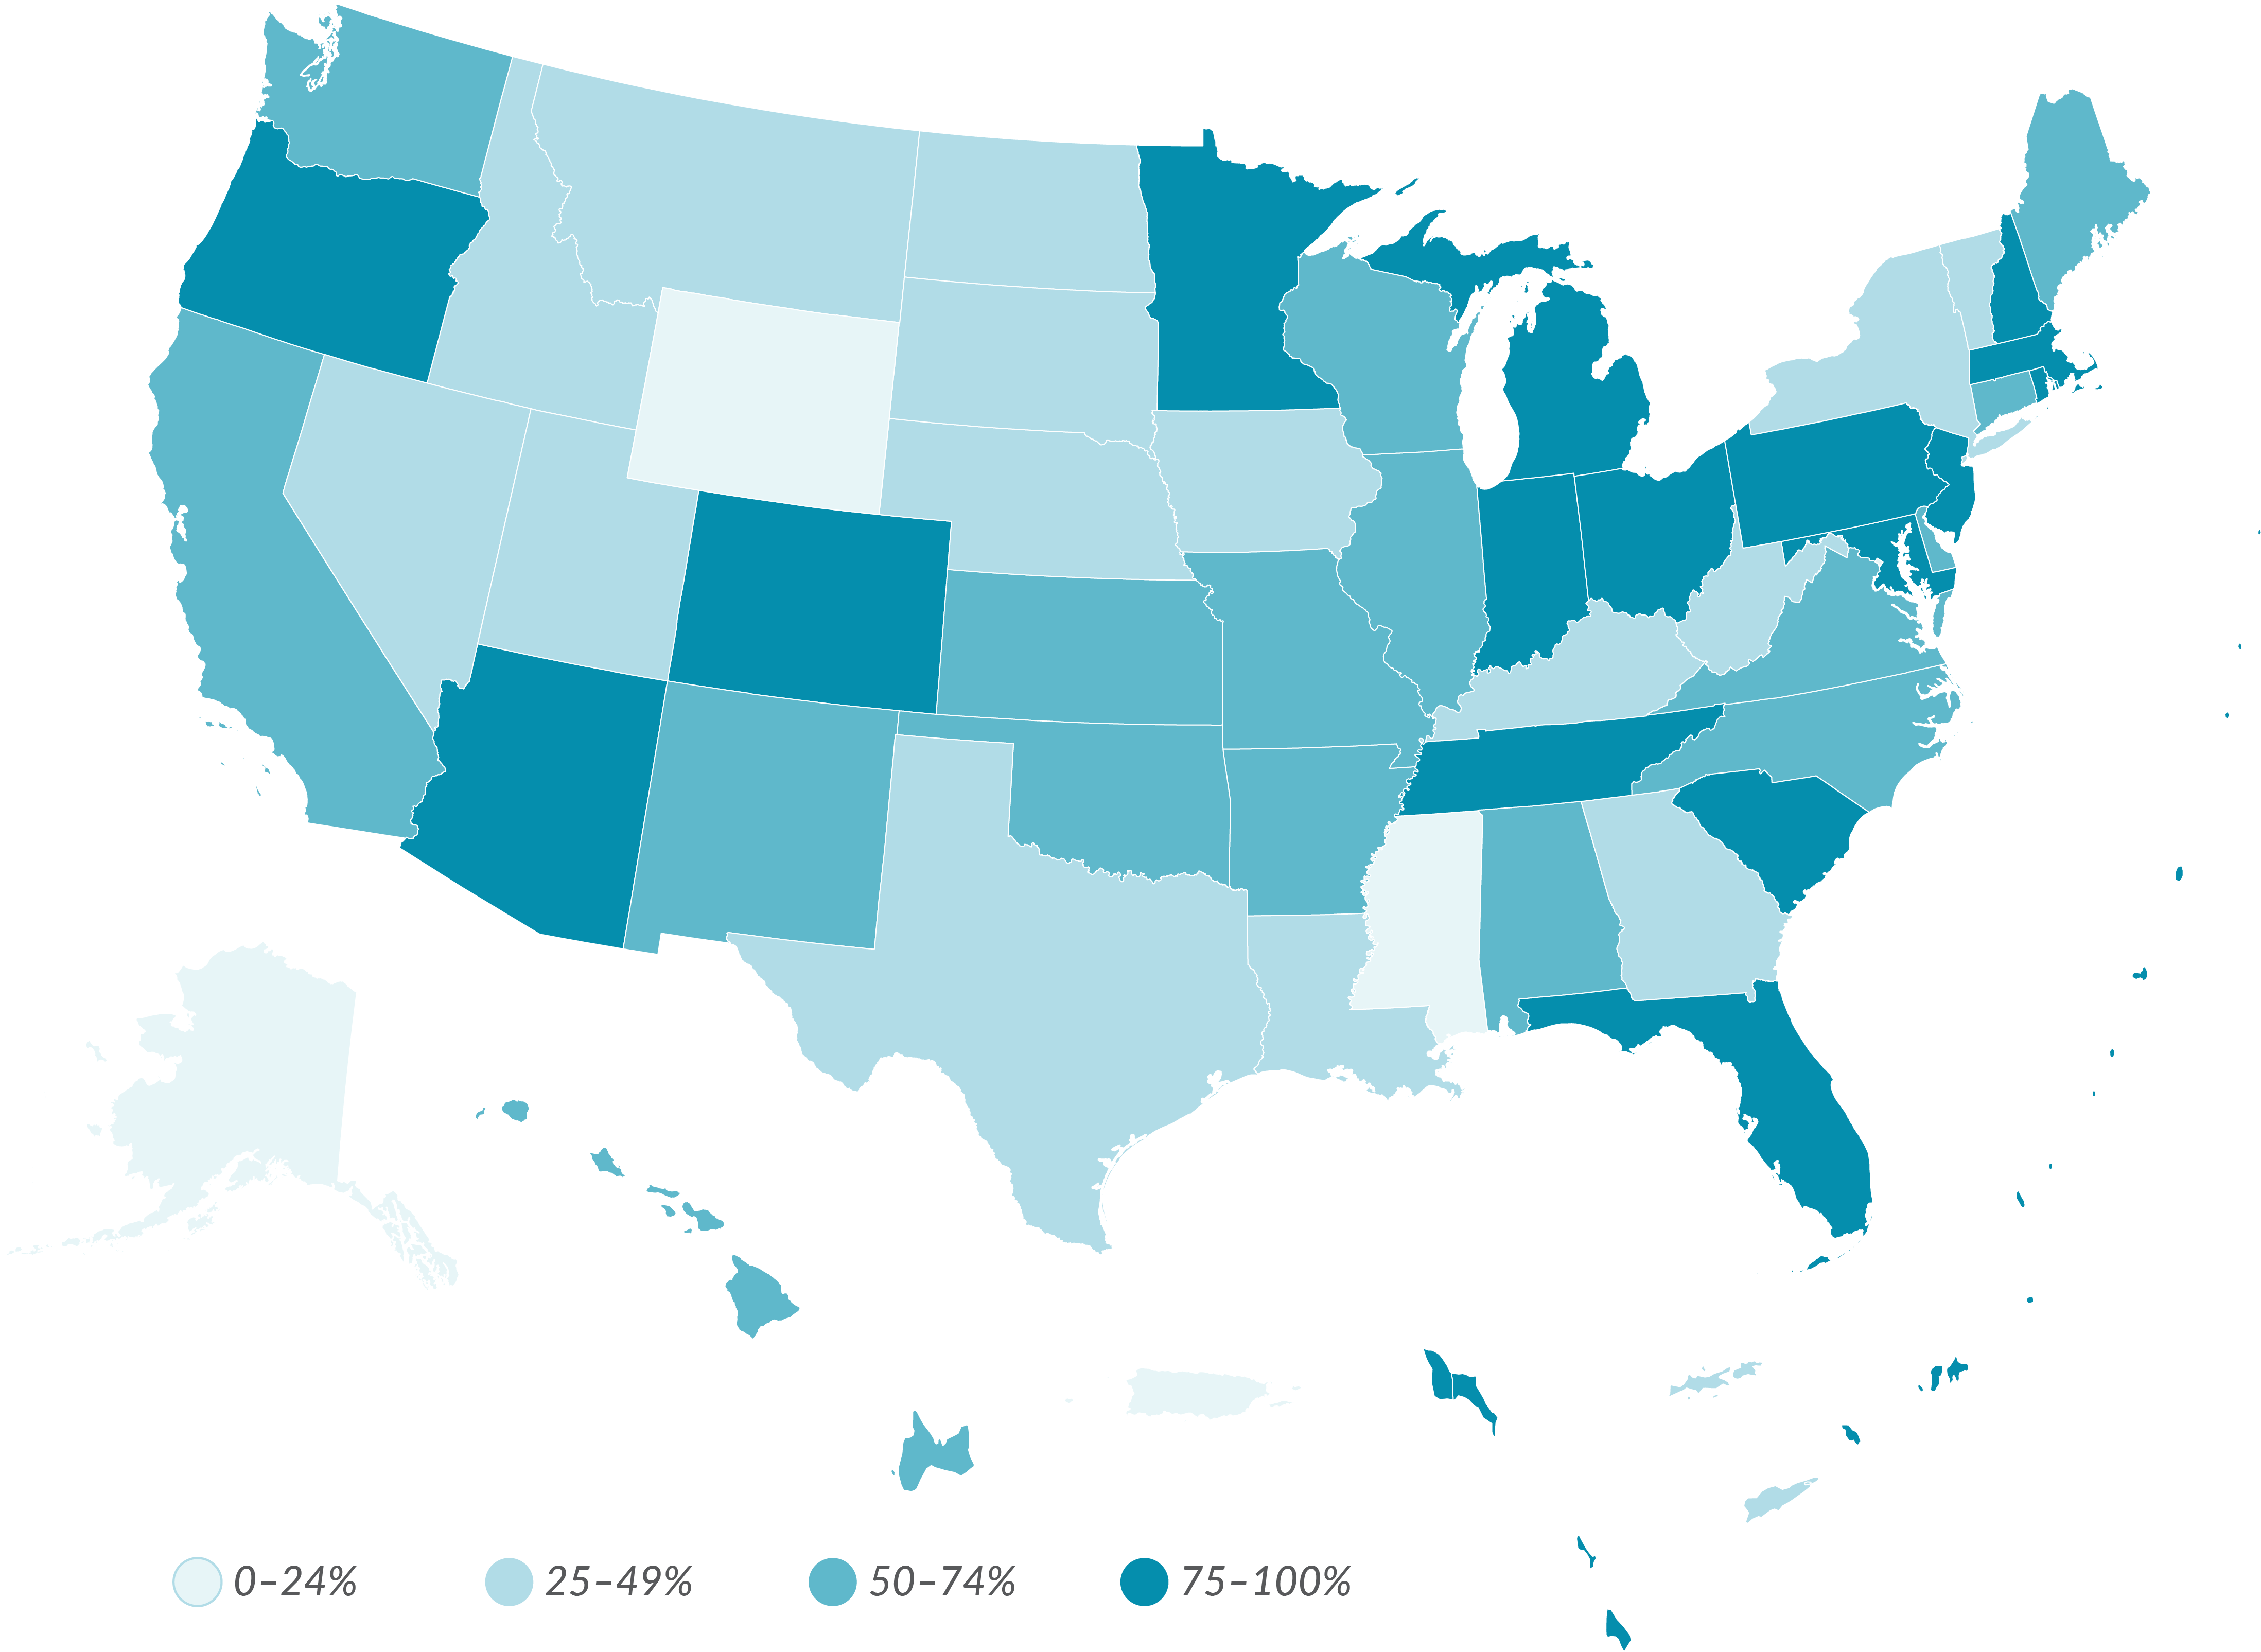
In 2021, 16 states and 2 territories served families in more than 75 percent of their zip codes. Three states, 1 territory, and the District of Columbia served families in fewer than 25 percent of zip codes. Excluding zip codes with no population, evidence-based home visiting served approximately 62 percent of zip codes across the United States. (Source: Estimates are based on data collected from 10 evidence-based model developers and from MIECHV on the zip codes their local agencies serve. The 10 models that provided service area data are Child First, Family Connects, Family Spirit, HANDS, HFA, HIPPY, MECSH, MIHP, NFP, and PAT. Five of these models (Child First, Family Spirit, HIPPY, MIHP, and NFP) provided county-level service data; all others provided zip codes served. We assumed that if a model served a county, it served all zip codes in that county, which may lead to an overestimate of service areas. MIECHV data were used to supplement model developer data, as not all evidence-based models had service area data available. Percentage served in each state was calculated based on the total number of unique zip codes served by home visiting and the total number of zip codes in each state. Zip codes with no population were excluded from the calculation to normalize across states. Population estimates are from the 2020 American Community Survey. Because not all evidence-based models were able to submit zip code service data, the calculated percentages may underrepresent home visiting coverage. Some zip codes not reported by model developers are accounted for in the MIECHV data.)Go to footnote #>3