
Nurse-Family Partnership
Nurse-Family Partnership seeks to improve participants’ lives in three key areas: pregnancy outcomes (by helping women improve prenatal health), child health and development (by helping parents provide sensitive and competent caregiving), and parents’ life trajectories (by helping them develop a vision for their future, plan subsequent pregnancies, continue their education, and find work).
What is the model’s approach to providing home visiting services?
Home visits take place based on a family’s level of need and a child’s age. Services are provided until the child’s second birthday. Nurse-Family Partnership requires families to initiate services prenatally before the birth of their child(ren).
Nurse-Family Partnership’s service population includes the following:
- Expectant caregivers (with an emphasis on first-time caregivers)
- Families facing multiple complex socioeconomic challenges
Who is implementing the model?
Home Visitors
Nurse-Family Partnership was implemented by 1,841 home visitors in 2025. The model requires a minimum of an associate’s degree in nursing for home visitors. The minimum caseload requirement for home visitors is between 21 and 25 families.
Supervisors
Nurse-Family Partnership was implemented by 367 supervisors in 2025. The model
requires a bachelor’s degree in nursing for supervisors; a master’s degree in nursing is
recommended.
Where is the model implemented?
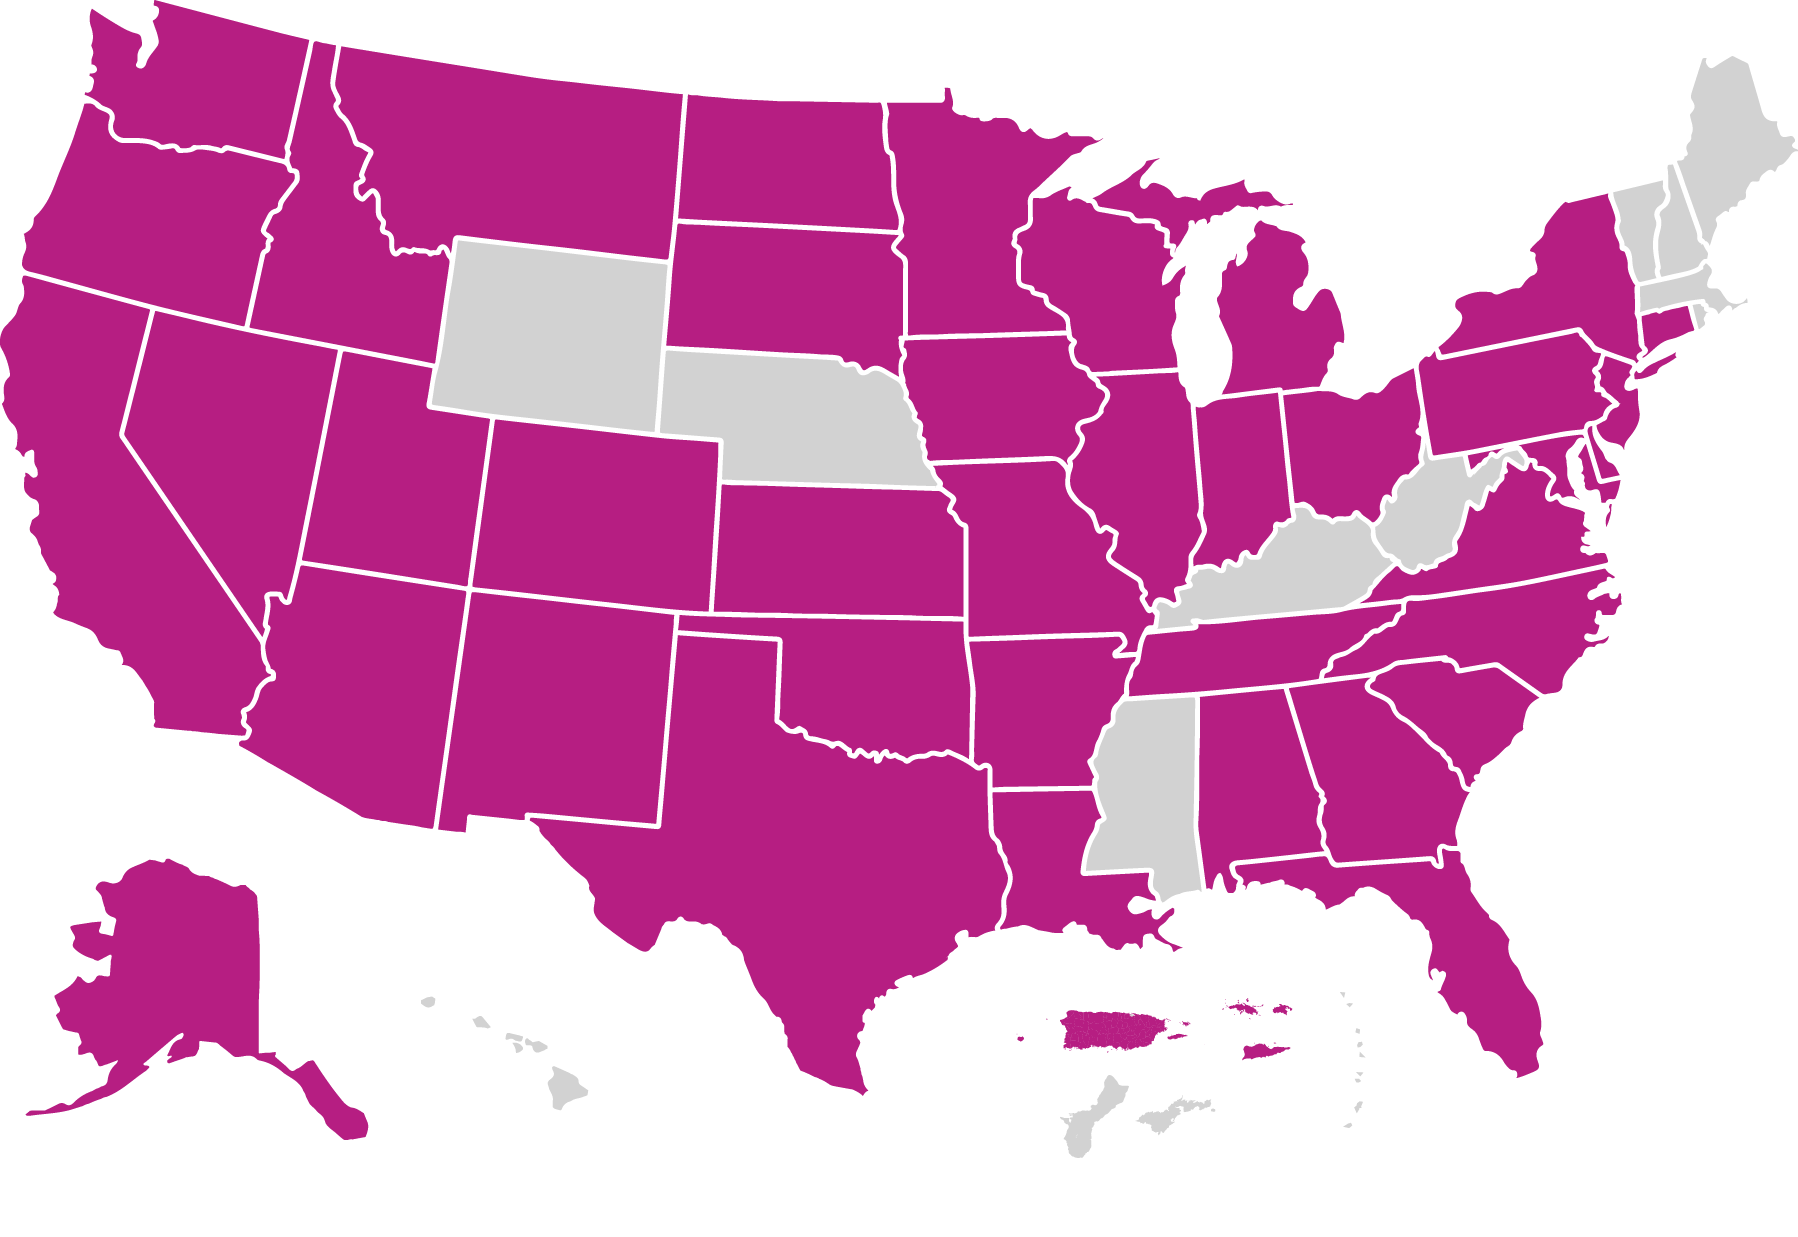
Nurse-Family Partnership operated in 252 local agencies across 39 states, the District of Columbia, Puerto Rico, the U.S. Virgin Islands, and 4 Indigenous communities in 2025. Nurse-Family Partnership also operated outside the United States and its territories in Australia, Bulgaria, Canada, England, Northern Ireland, Norway, and Scotland in 2025.
Families Served Through Evidence-Based Home Visiting in 2025



Race
3% American Indian Alaska Native
3% Asian
31% Black
<1% Native Hawaiian Pacific Islander
55% White
8% Multiple
Ethnicity
40% Hispanic or Latino
60% Not Hispanic or Latino
Caregiver age
27% ≤21 years
49% 22-29 years
24% 30-44 years
<1% ≥45 years
Caregiver education
20% No HS diploma
68% HS diploma or GED
9% Some college or training
4% Bachelor's degree or higher
Household income
97% Low-income status
3% Not low-income status
Child age
45% <1 year
55% 1-2 years
0% 3-5 years
Child insurance status
86% Public
5% Private
8% None
Primary language
78% English
18% Spanish
4% Another language